nz-solar-potential
Webmap interface
A web view of New Zealand’s rooftop solar potential, publicly viewable from: rewiring-nz.github.io/nz-solar-potential/.
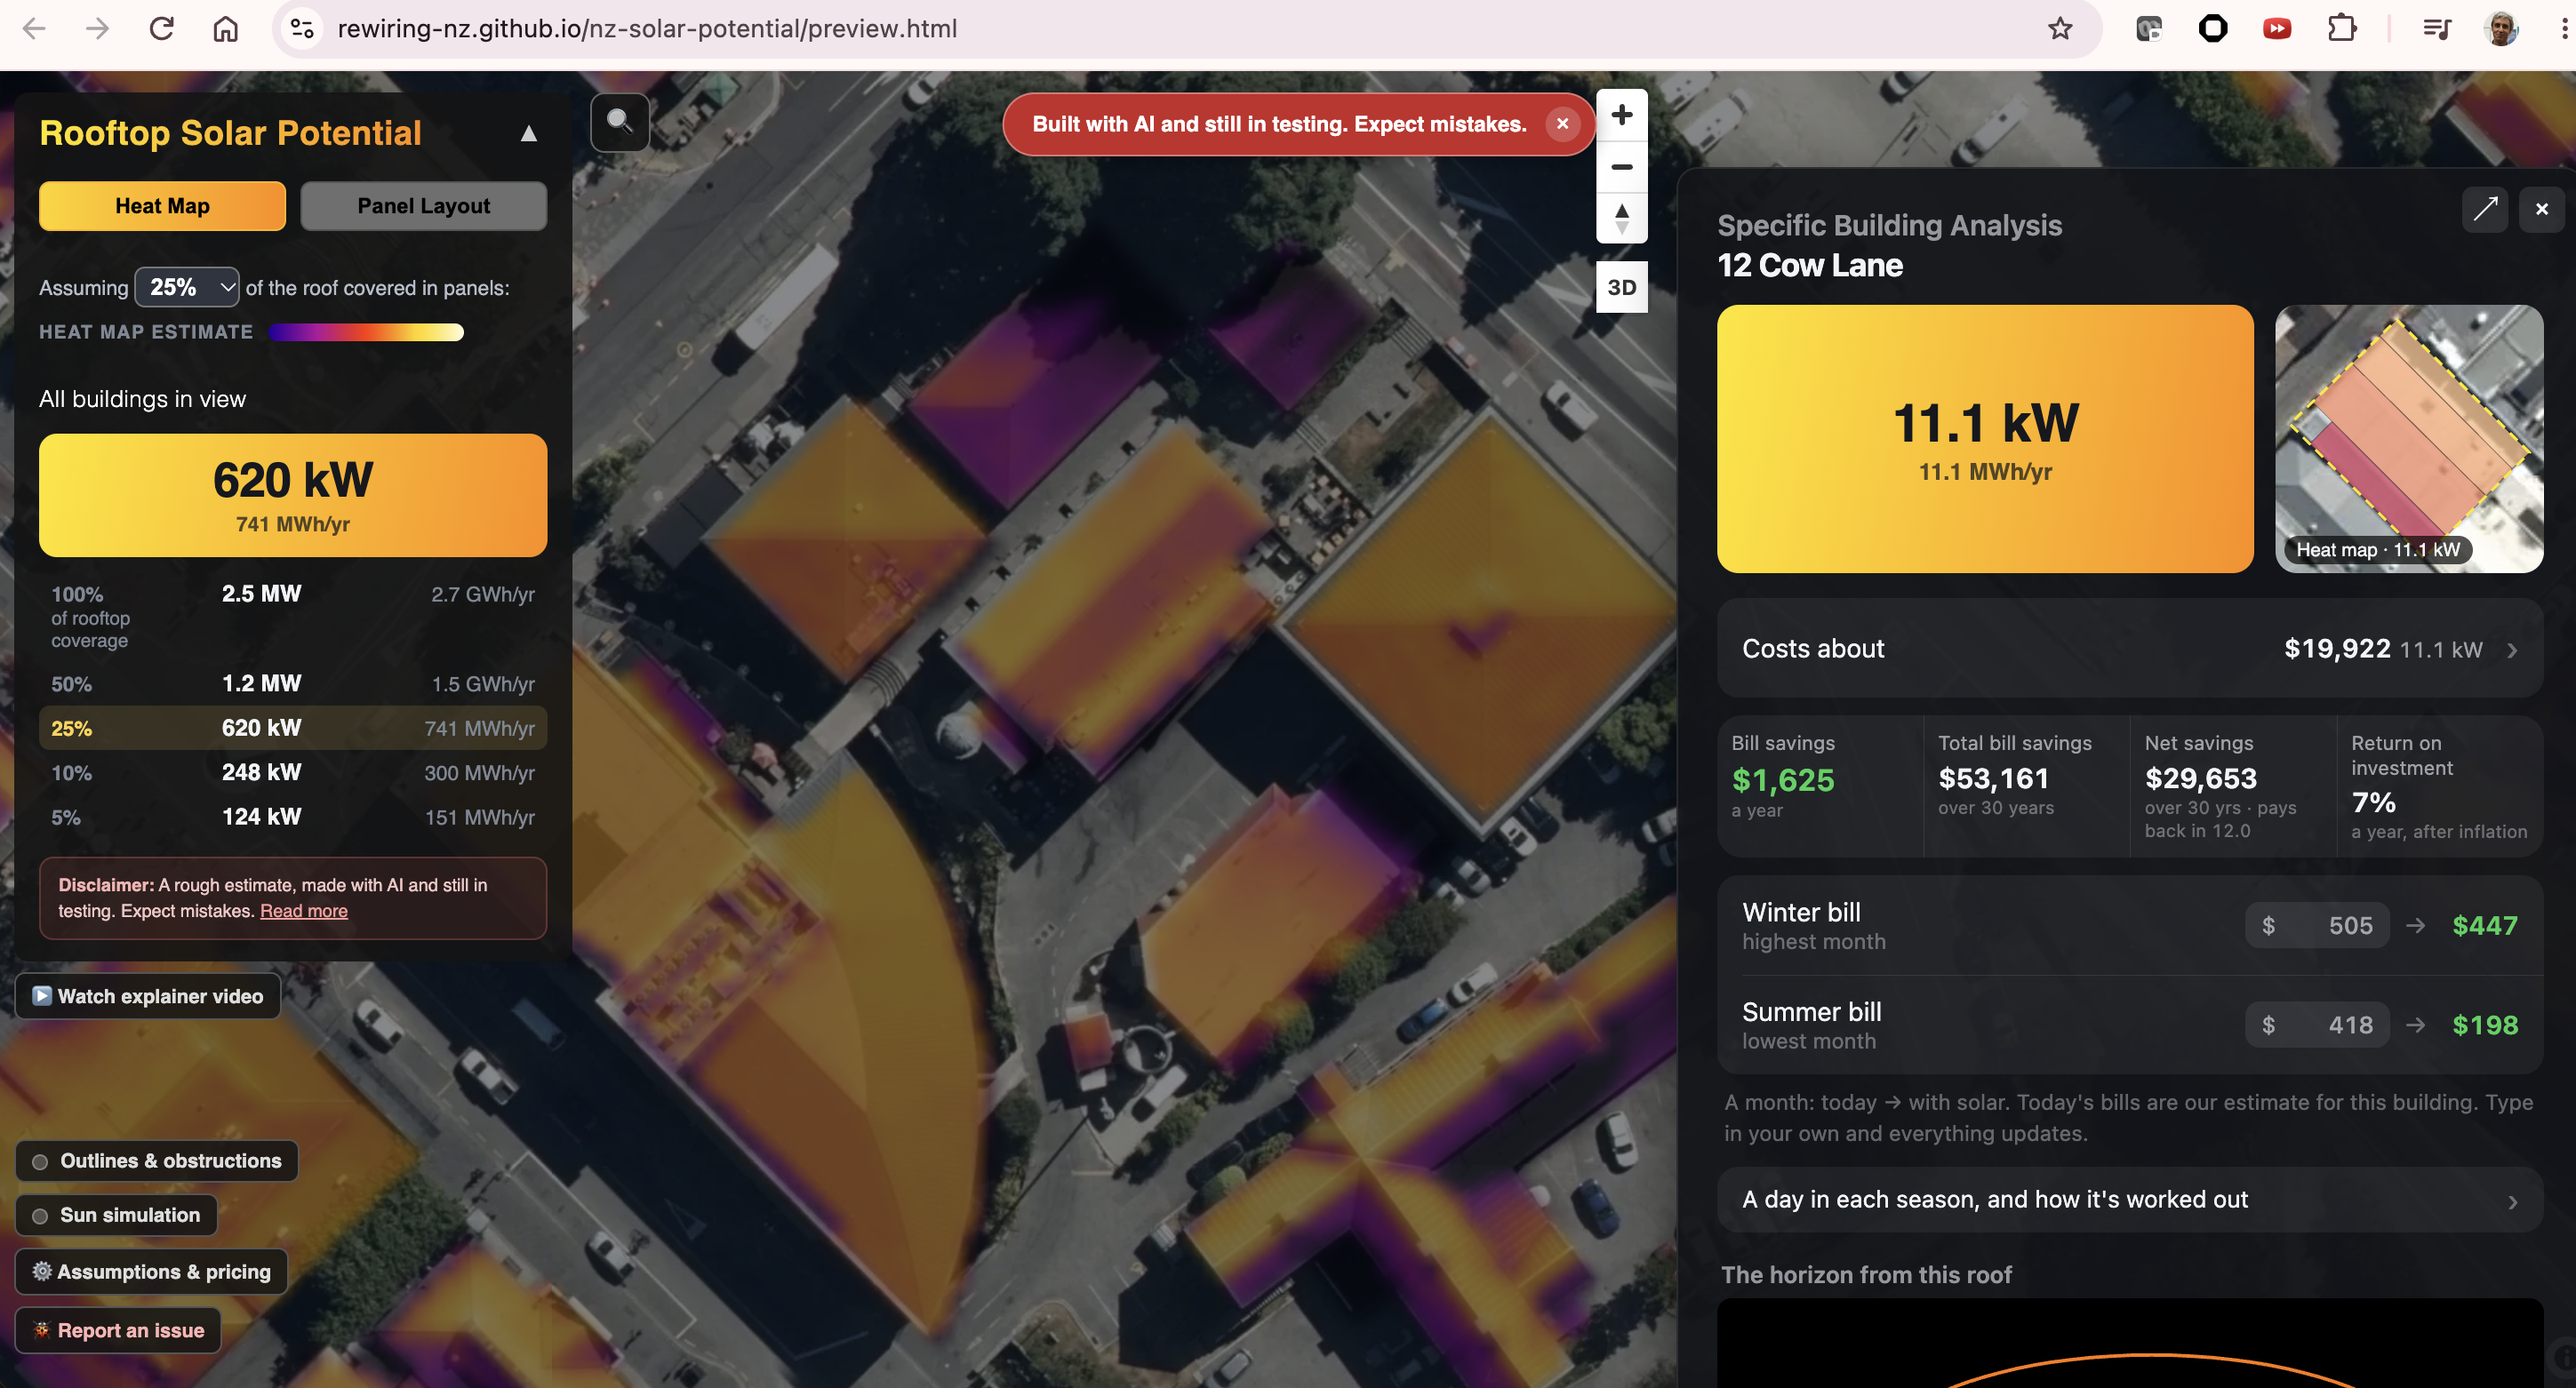
Heatmap view of rooftop solarpotential
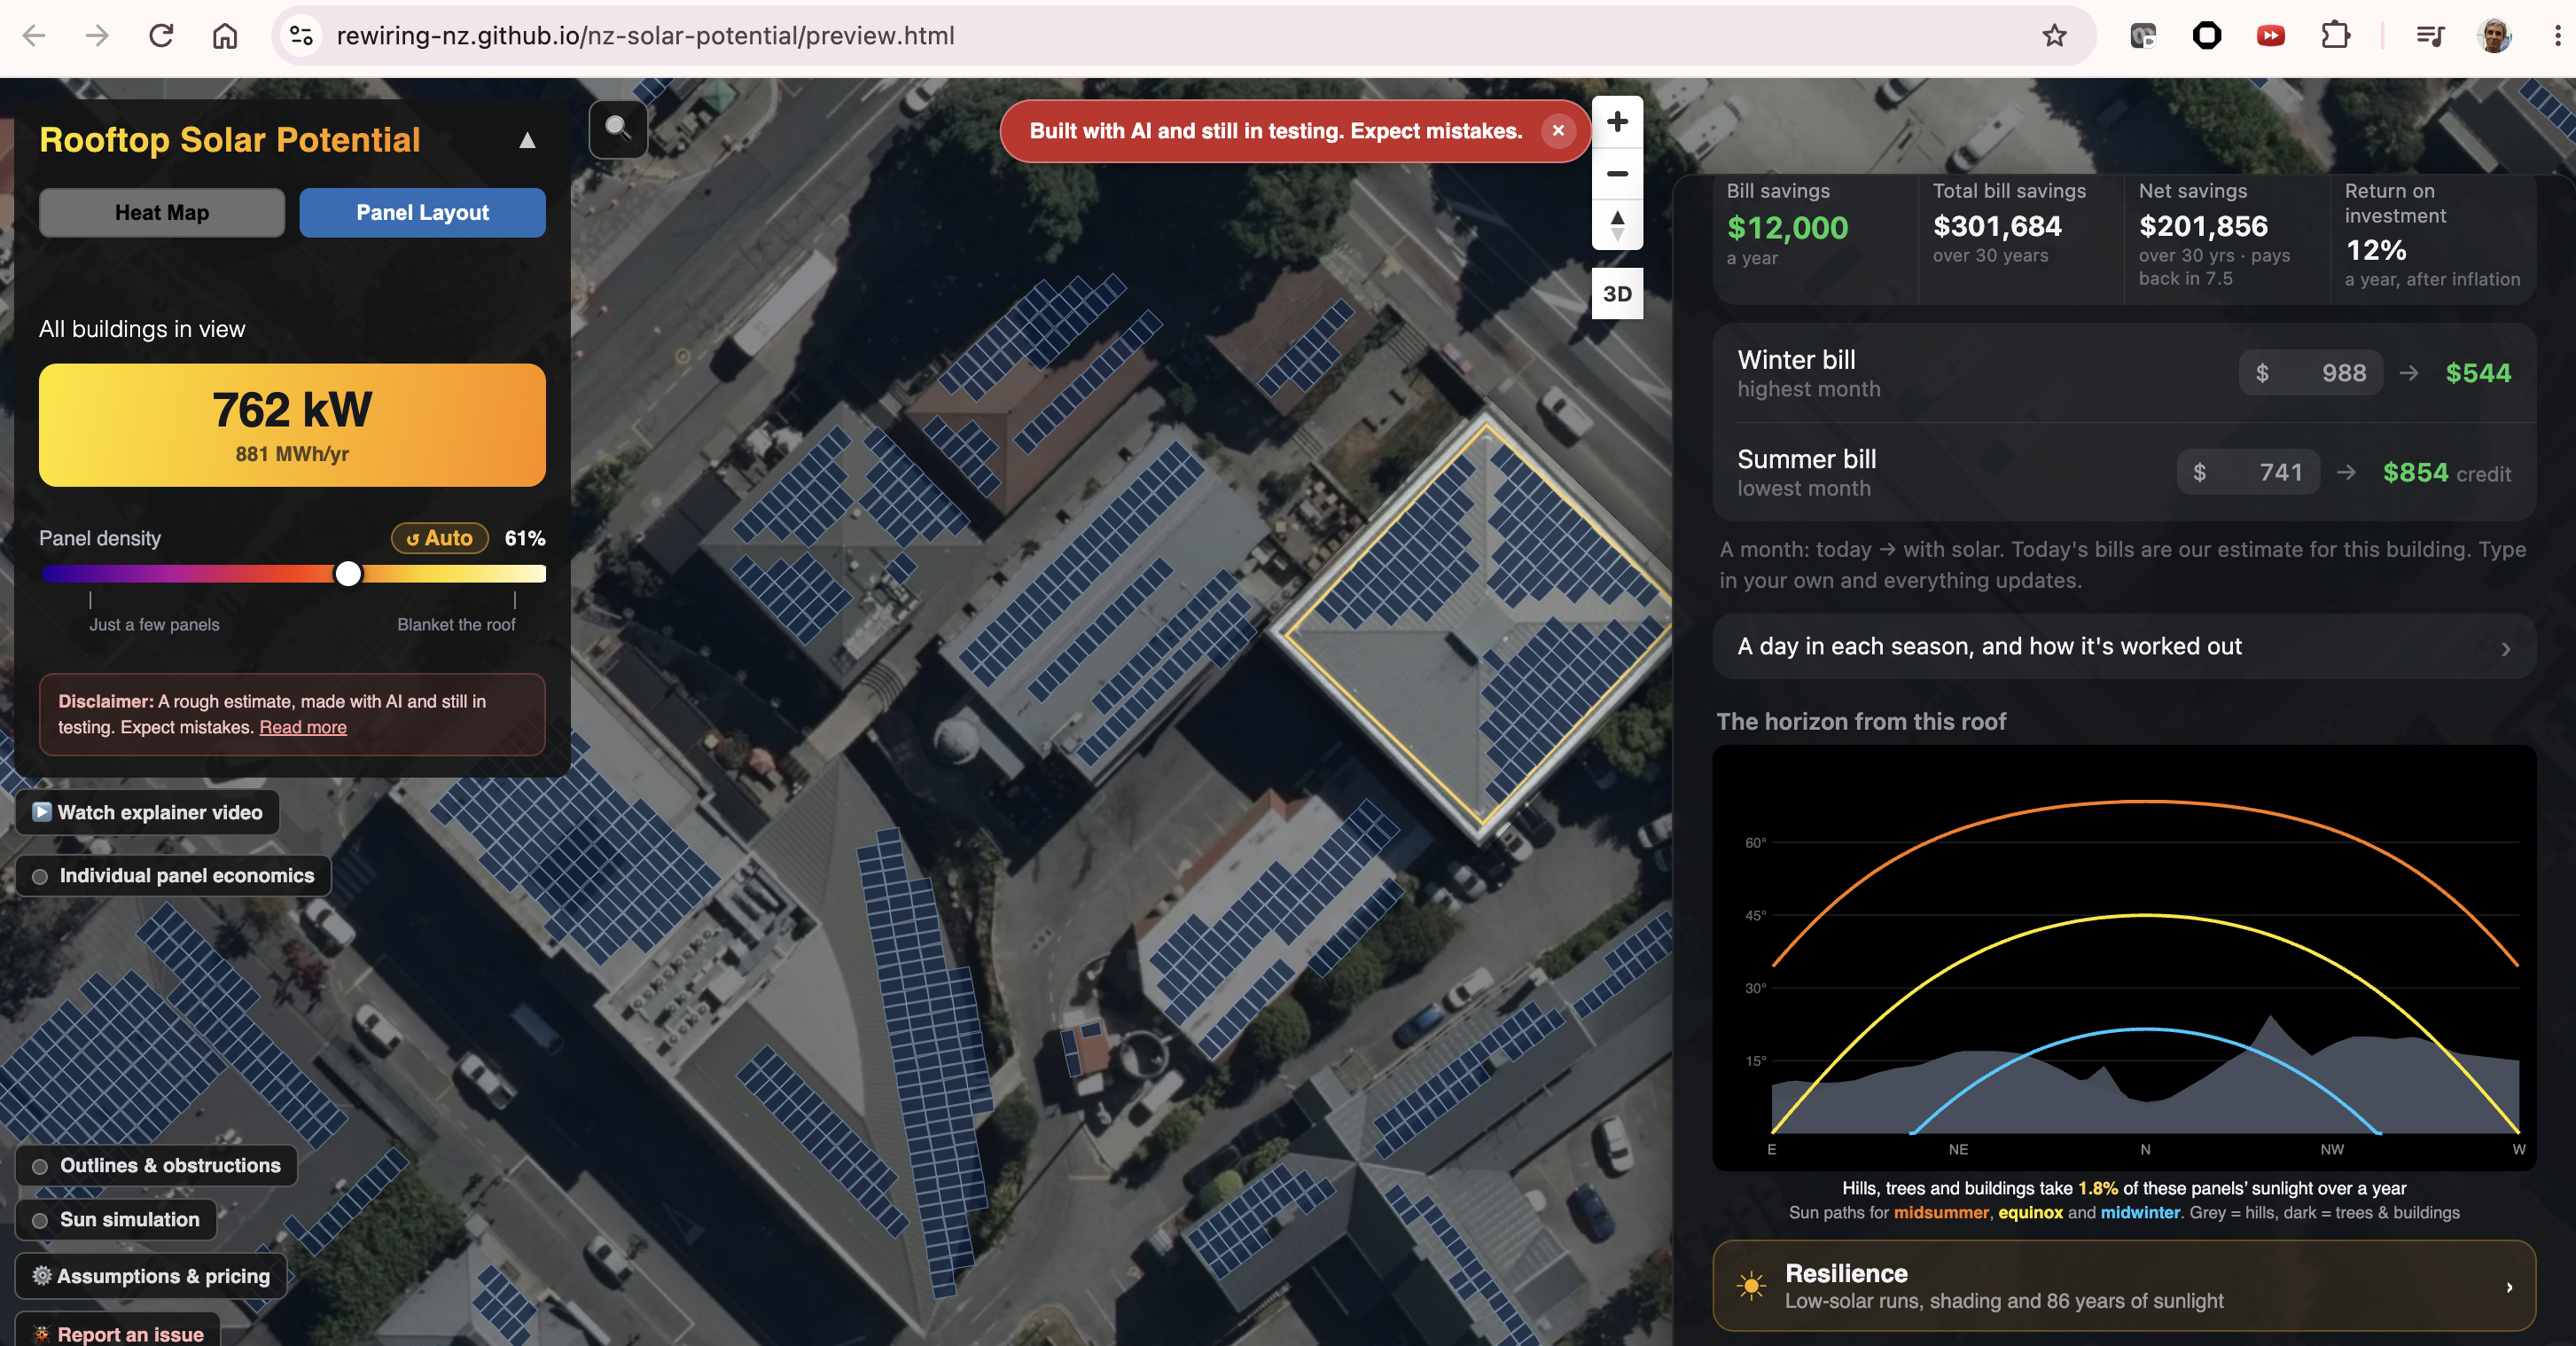
Panellayout view of rooftop solarpotential
[!WARNING] The map is a planning aid, not a system design, quote or guarantee.
Developer map access
Data maintainers and developers can view their local updates. Use the URL printed when the build finishes; the destination depends on how it ran:
| Build or preview | Where to open it | Availability |
|---|---|---|
| Local quickstart | The printed Map preview URL, usually http://127.0.0.1:8765/rooftop-solar.html?...; also recorded in the run’s report.md |
Only on your computer while the preview server runs. The port can change; the printed URL centres the map on the built region. |
| Shared-cloud quickstart | The printed Developer preview URL: https://storage.googleapis.com/rewiring-solar-previews/devel/GITHUB_ALIAS/rooftop-solar.html |
Public and shareable. The alias opens its latest published preview; previews expire after 14 days unless refreshed. |
| Developer-VM profile | Start the documented --cloud preview SSH tunnel, then open http://127.0.0.1:8765/rooftop-solar.html using the tunnel’s port |
Only on your computer while the VM’s preview server and SSH tunnel run. It is not a public preview URL. |
| District or worker build without preview publication | No browser URL is created by the build alone. Use Serve locally for combined outputs. | Worker outputs must be collected and combined before previewing the complete map. |
| Production release | The public GitHub Pages URL above | Updated only after the release is published and the site’s data pointer switches. |
If automatic browser opening fails, copy the printed URL into your browser.
127.0.0.1 links are local to the person opening them; send a public
developer-preview link when sharing a build with someone else.
The simple map is rooftop-solar.html; old preview.html links redirect to
it, preserving their query string and fragment. Open Tools & docs in the
map’s bottom-left controls to reach Build data or the documentation. Build
data requires its local backend; it cannot run builds from static hosting.
Look at a building
- Find the building by searching or moving the map.
- Click its roof to see panel count, system size (kWp), and daily and yearly output.
- Use the heat map to compare roofs, and the panel layout to see roof faces, obstructions and panels. Facet colours show roof geometry, not solar yield: hue follows compass direction (north at the top of the compass wheel), while saturation increases with pitch and reaches its cap at 45°. Flat faces are grey; missing or invalid direction/pitch is pink. The same legend is available with the catalogue’s Roof facets layer.
- In the building panel, switch the seasonal curves between Average and Sunny day, or open Horizon to see the skyline (hills, trees, buildings) against the sun’s path in summer, at the equinox and in winter.
Layers and legend
Detailed dataset controls for local build decisions live in the Build data workspace. Open Layers & legend below the map navigation controls. The workspace shares the grouped layer legend and map-layer definitions with the canonical map. Groups can be collapsed, and checkboxes show or hide overlays. Basemap radio buttons choose Aerial (Esri / LINZ) or OpenStreetMap without clearing the other layers. Both basemaps need internet access.
The stack, from top to bottom, is:
- Rooftop solar analysis: panel layouts, solar-analysis building outlines, then the solar heat map. Panels paint above outlines; outlines paint above the heat map. In Build data, catalogue layers toggle independently; panels and the heat map can both be enabled. Roof facets and obstructions from the analysis dataset also toggle independently. The simple rooftop map retains its existing mutually exclusive Heat Map and Panel Layout modes.
- Derived datasets: available intermediate calculation outputs.
- Source datasets: available dataset footprints. A faint fill and dashed outline show a cached file’s extent, not guaranteed valid-data coverage.
- Basemap.
Details explains each layer; Zoom fits the map to its extent when known. Select Query beside a vector layer, then click the map to see the attributes of features at that point. Selecting a query layer enables it without hiding other layers. Raster overlays do not expose pixel-value queries; source footprints expose cache metadata rather than raw point-cloud points or raster samples.
On the local Build data server, Local lists cached sources and available calculations in that checkout. Remote Developer and Published source catalogues are not currently available in the panel. Cached extents show file coverage only, not guaranteed valid-data coverage.
Read the numbers
kWpis the panels’ nameplate rating at Standard Test Conditions, not continuous output.kWhfigures are model estimates. They use each roof face’s slope and direction, sunlight calibrated to NIWA measurements, shading from hills, trees and buildings, and the PV assumptions inconfig.py.- Horizon shows the share of the year’s direct sun the roof keeps after hills and nearby objects.
- A roof with no panels is not necessarily bad for solar. It may be too small after setbacks, too steep, too shaded, or not readable from the data.
Limits
- The data has capture dates. New buildings, demolitions, tree growth and roof changes may be missing.
- Roof faces are inferred from LiDAR and photos. Small, curved or complex roofs can be read wrongly.
- Photo-based obstruction detection is cautious. It can block usable roof and miss equipment the same colour as the roof.
- It does not check structure, wiring, consent, fire access, export limits or site access.
Before installing, get a qualified installer to inspect the site and design the system.